A key breadth indicator, which has indicated every swing top thus far in 2022, generated another sell signal on Friday.
By the way, in case you’re wondering, today’s title is a direct reference to my friend Tom Bowley’s quite well-timed show on StockCharts TV, where he made an unpopular but excellent bullish call on stocks. Take a bow, Tom. That was nice.
But in the two months since, we’ve now seen a dramatic reversal in many of the breadth and sentiment indicators that proved so accurate in suggesting a market bottom. For example, back in June, about 5% of the S&P 500 members were below their 50-day moving average. This week, that same indicator reached up to over 90%.
The VIX was above 30 back in mid-June, as panicked sellers were driving volatility readings near their highest levels in 2022. Going into this weekend, the VIX sits just above 20, near the lowest levels for the VIX in 2022.
August into September has been a seasonally weak time of the year for Technology. What does that mean in 2022? Join us for our next FREE webinar “Seasonal Struggles for Technology” on Tuesday, August 23rd at 1:00pm ET. We’ll look at what has often happened as summer rotates into fall, how that relates to the four-year Presidential cycle, and what that means as the major averages are testing key resistance levels!
Can’t make it? No problem. Just sign up HERE and we’ll send you the replay as soon as it’s available.
Our spectacular point & figure charting engine allows us to calculate “bullish percent” indexes for the major market averages. Basically, a point & figure chart is either bullish or bearish at any given point. So we can calculate what percent of stocks in a particular universe are in a bullish phase according to their individual point & figure charts.
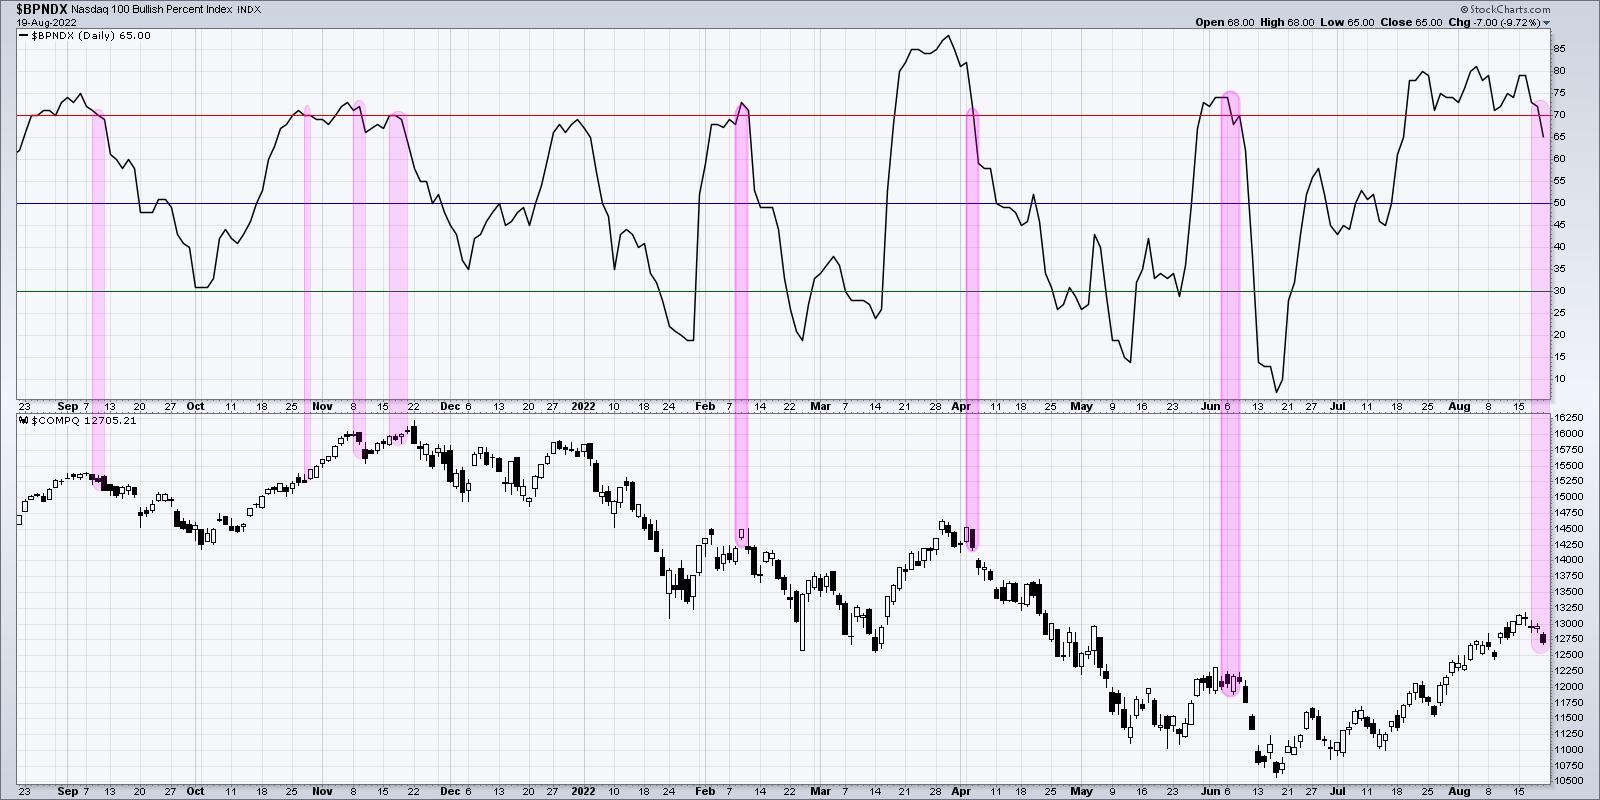
So here’s the Bullish Percent Index for the Nasdaq 100 Index.
You’ll see that, back in mid-June, less than 10% of the $NDX members were in a bullish phase. By late July, that number had risen all the way up to 80%. That means about 70% of the Nasdaq 100 members had a buy signal on their point & figure chart!
On Friday of this week, the indicator moved back below the 70% level for the first time in four weeks. How many times has this signal occurred in 2022? Three times, on February 10, April 6 and June 7. That’s right, pretty much three best selling opportunities in 2022 after the initial selloff in January. Given the run up off the June low, the key resistance levels just above current levels, and overbought conditions demonstrated by many stocks this week, a pullback in the coming weeks certainly makes sense.
On my show this week, I interviewed one guest with an upside target of S&P 6000, then another with deep downside targets given the Elliott Wave structure. In the end, I’ve always found it valuable to consider all the potential outcomes, which helps me open my mind to new possibilities for making sure I manage risk appropriately.
I wouldn’t be surprised if we finish 2022 in a position of strength. There is certainly plenty of buying power ready to be unleashed in risk assets, as evidenced by the last eight weeks. But this Friday may have been the signal that all is not well, that macro headwinds which propelled the market lower into the June low still very much exist, and that a hawkish Fed and rising interest rates can frustrate growth stocks for many months to come.
At the end of the day, we have to follow the evidence. And based on one breadth indicator that has tracked 2022 quite well, the evidence is quite bearish.
RR#6,
Dave
P.S. Ready to upgrade your investment process? Check out my YouTube channel!
David Keller, CMT
Chief Market Strategist
StockCharts.com
Disclaimer: This blog is for educational purposes only and should not be construed as financial advice. The ideas and strategies should never be used without first assessing your own personal and financial situation, or without consulting a financial professional.
The author does not have a position in mentioned securities at the time of publication. Any opinions expressed herein are solely those of the author, and do not in any way represent the views or opinions of any other person or entity.